Table of Contents
ECMLink 101 - Datalogging tips
On this page, we're going to assume you've already run through the install procedure and have gotten a good connection established with the ECU. If you have not, please review the Installation page first.
We are also going to assume you have already walked through the basic Initial checks page. If not, please do so!
Furthermore, we are going to assume you already know all the Datalogging basics.
Overview
Datalogging is such a critical feature in ECMLink that we felt it wise to provide a page specifically about the function. On this page you'll find tips on how to efficiently navigate and use the datalogging function in ECMLink.
Please note that the “Operation” page of the integrated help file in the ECMLink application provides a LOT of information on this topic as well as a number of other application usage matters. PLEASE read this page to gain familiarity with keyboard short cuts and mouse gestures.
Right mouse - Pan/Zoom
IMO, one of the coolest features of ECMLink's datalog component is the ability to quickly pan and zoom through a log file using the right mouse button. With a datalog opened, press and hold the right mouse button while you drag the mouse up/down to zoom or left/right to pan. This feature can make navigating a log file VERY efficient. My personal usage pattern when opening a new log file will be:
- Press and hold right mouse button
- Drag mouse down until entire log file is visible
- Drag mouse left/right to center a particular section that looks to be of interest
- Drag mouse up to zoom into that section
- If that section is not of interest after all, I'll drag down again to zoom back out and pan left/right to find another section and repeat the sequence until I find something I'm looking for.
Preferences note: If you find the zoom feature too sensitive or if you'd like to increase how quickly panning scrolls based on amount of mouse movement, you can do that in the Graph preferences dialog described below. My personal preference is a drag pan factor of 2.8 and a drag zoom trigger of 18 pixels. Each system and each user will call for different values based on personal preference and system components.
Platform note: Unfortunately, mouse gestures change from one platform to the next. Under Windows, for example, a pop-up menu isn't typically triggered until the mouse button is released. Under Linux and Mac OS X, a pop-up menu is typically triggered as soon as the mouse button is pressed. The ECMLink application makes every effort to preserve those native behaviors, but this makes doing things like panning and zooming on mouse drag more complicated. To work around these differences, we introduce Ctrl-Left-click and Shift-Left-click modifiers. If you hold the Ctrl or Shift key down while you click the left mouse button, the application will respond as though you pressed the right mouse button for drag operations.
Graph preferences
 Right click in a graph and select “Graph preferences”. This dialog configures global preferences related to the operation of the graph display component.
Local view settings
Here you can change the default graph legend font size, graph back ground color, number of legend columns, etc. These changes, as the name of the tab implies, affect only the current view (current datalog tab) unless you also check the “save as defaults” button before hitting OK. If you check that button before hitting OK, then the values you specified in the dialog will be used for future datalog tabs as well as the current.
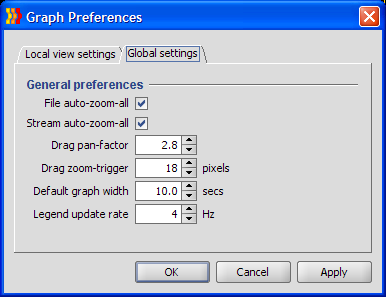
Global settings
In the “Global settings” tab, you can also change behavior related to the default graph width and drag pan/zoom (right mouse button) behavior. If you find that the drag zoom is too sensitive, you can adjust how many pixels of movement are required to activate it. If you find that the drag pan feature needs to be faster, you can increase the pan factor.
Selection area
You can use the left mouse button to select an area of the graph. You can also use the shift-left/right arrow keys to extend a selection one point at a time.
When an area of interest selected, you can double click in this area to automatically zoom the graph to show only that section on the screen. This can be useful to locate a pull, for example, and zoom into only that area for more detailed analysis.
As you extend a selection area, the time display in the lower right hand corner of the screen will update to show the current selection timestamp as well as the width of the current selection area. This can be useful in calculating 0-60 or 60-90 times, for example. Simply place the graph cursor at the starting point of interest and then use the shift+arrow keys to extend the selection to the end point. The selection width will indicate how much time elapsed between those two points.
Show/hide-all
The hide-all function is deceptively useful. At first it seems like there's really no point in hiding everything off the display. But in fact, it's useful when you actually want to momentarily compare a couple different values or look for some particular event. You can use the “Toggle hide-all” (Ctrl-Q) function to remove everything from the display and then re-display the items of interest one at a time by clicking the graph line box next to the item's name in the graph legend.
You can use this to look for high throttle areas, for example. Hit Ctrl-Q to hide everything, then display only throttle position in the graph. Scroll to the area where that one item spikes high, select the area, zoom into it and then hit Ctrl-Q again to redisplay everything.
Comparing two datalogs
This is a little hard to explain in written words. But I'll give it a try.
It's very common to want to compare two datalogs side by side to see exactly where differences might exist. Until we add a specific screen for this function (it's planned), you can do much the same thing by simply toggling between two datalog tabs that are positioned and zoomed into the same common areas.
For example, let's say you have two datalogs each with a 3rd gear pull from 4000 RPM to 8000 RPM. Position the display cursor on, say, 6000 RPM in each log and hit the space bar to center the graph at that point.
Now the two graph tabs are centered at the same point. To make sure they are zoomed identically, select the View→Zoom default item in each tab. This resets the zoom level to the graph display default width preference (see graph preferences above).
Now both tabs are centered at the same point and zoomed out to the same level. They are effectively scaled and positioned identically. Now all you have to do is quickly switch between the tabs to visually see differences between them “pop out” at you.
To do that, click on the tab name of one and then click again so that a blue box is around the tab name which indicates that the tab itself has focus and not some component inside the tab. With that selected, you can use the left/right arrow keys to quickly switch between the two tabs. You will, of course, what to make sure the tabs are immediately next to each other for the easiest comparison. You can even close all other tabs and then just use the right arrow key by itself to automatically toggle between them!
Page Tools
